
| Official Gene Symbol | Other Aliases |
|---|---|
| GLS | GLS1, KIAA0838 |
| Sequence Length (AA) | Molecular Weight (Da) |
|---|---|
| 669 | 73461 |
| Protein Name |
|---|
| Glutaminase kidney isoform, mitochondrial |
| Sources | |
|---|---|
|
UniProt PhosphoSitePlus ® GeneCards |
Human Protein Atlas |
| 10 | 20 | 30 | 40 | 50 |
| MMRLRGSGML | RDLLLRSPAG | VSATLRRAQP | LVTLCRRPRG | GGRPAAGPAA |
| 60 | 70 | 80 | 90 | 100 |
| AARLHPWWGG | GGWPAEPLAR | GLSSSPSEIL | QELGKGSTHP | QPGVSPPAAP |
| 110 | 120 | 130 | 140 | 150 |
| AAPGPKDGPG | ETDAFGNSEG | KELVASGENK | IKQGLLPSLE | DLLFYTIAEG |
| 160 | 170 | 180 | 190 | 200 |
| QEKIPVHKFI | TALKSTGLRT | SDPRLKECMD | MLRLTLQTTS | DGVMLDKDLF |
| 210 | 220 | 230 | 240 | 250 |
| KKCVQSNIVL | LTQAFRRKFV | IPDFMSFTSH | IDELYESAKK | QSGGKVADYI |
| 260 | 270 | 280 | 290 | 300 |
| PQLAKFSPDL | WGVSVCTVDG | QRHSTGDTKV | PFCLQSCVKP | LKYAIAVNDL |
| 310 | 320 | 330 | 340 | 350 |
| GTEYVHRYVG | KEPSGLRFNK | LFLNEDDKPH | NPMVNAGAIV | VTSLIKQGVN |
| 360 | 370 | 380 | 390 | 400 |
| NAEKFDYVMQ | FLNKMAGNEY | VGFSNATFQS | ERESGDRNFA | IGYYLKEKKC |
| 410 | 420 | 430 | 440 | 450 |
| FPEGTDMVGI | LDFYFQLCSI | EVTCESASVM | AATLANGGFC | PITGERVLSP |
| 460 | 470 | 480 | 490 | 500 |
| EAVRNTLSLM | HSCGMYDFSG | QFAFHVGLPA | KSGVAGGILL | VVPNVMGMMC |
| 510 | 520 | 530 | 540 | 550 |
| WSPPLDKMGN | SVKGIHFCHD | LVSLCNFHNY | DNLRHFAKKL | DPRREGGDQR |
| 560 | 570 | 580 | 590 | 600 |
| VKSVINLLFA | AYTGDVSALR | RFALSAMDME | QRDYDSRTAL | HVAAAEGHVE |
| 610 | 620 | 630 | 640 | 650 |
| VVKFLLEACK | VNPFPKDRWN | NTPMDEALHF | GHHDVFKILQ | EYQVQYTPQG |
| 660 | 669 | |||
| DSDNGKENQT | VHKNLDGLL |
Data source: UniProt
Uniprot Database Entry PhosphoSitePlus ®
loading

Data source: Panorama
View Details (opens in a new window)
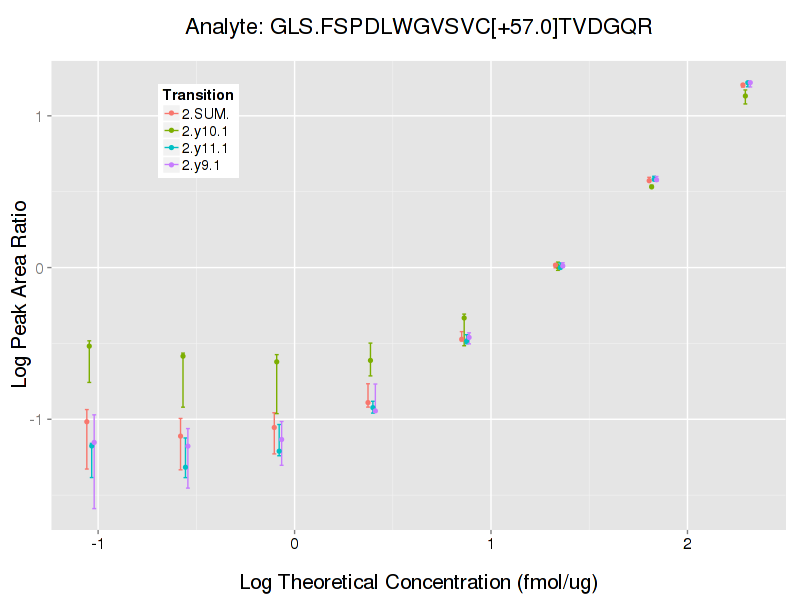
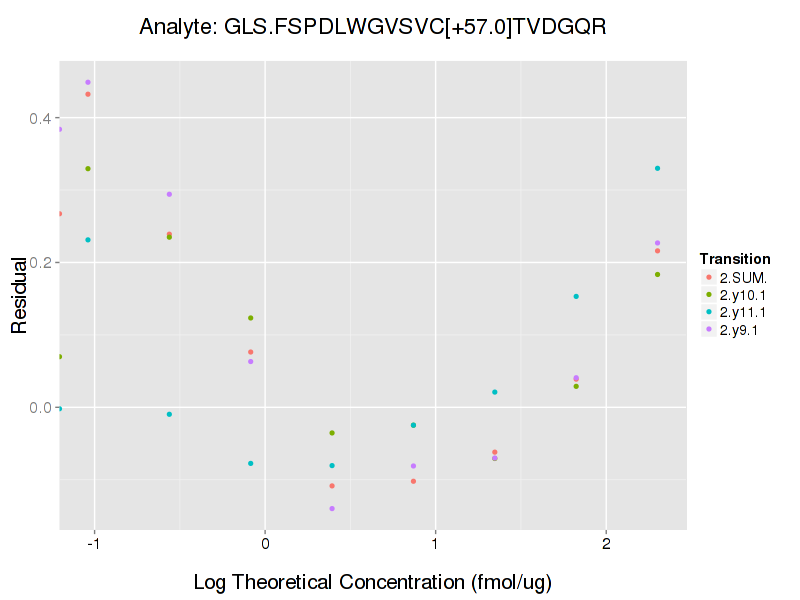
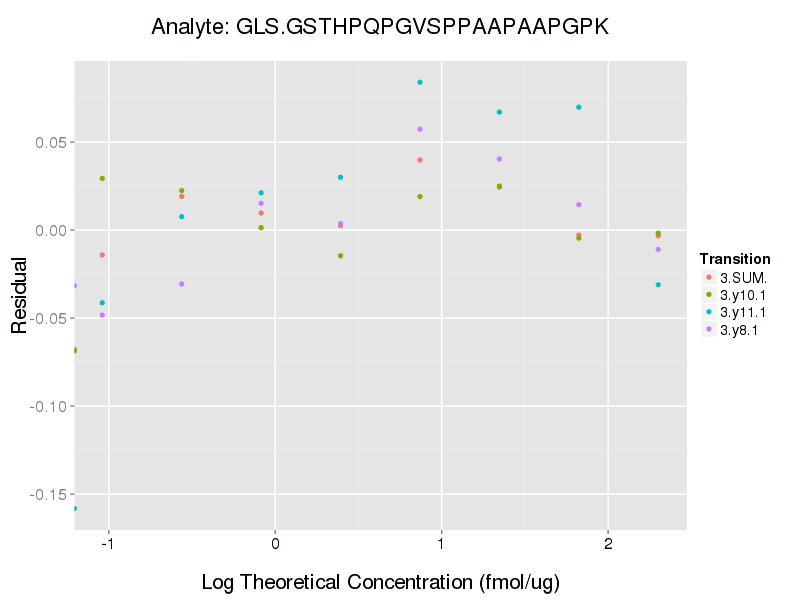
Demonstrating the feasibility of large-scale development of standardized assays to quantify human proteins. Kennedy JJ, Abbatiello SE, Kim K, Yan P, Whiteaker JR, Lin C, Kim JS, Zhang Y, Wang X, Ivey RG, Zhao L, Min H, Lee Y, Yu MH, Yang EG, Lee C, Wang P, Rodriguez H, Kim Y, Carr SA, Paulovich AG. Nat Methods. 2014 Feb;11(2):149-55. doi: 10.1038/nmeth.2763. Epub 2013 Dec 8. PMID: 24317253
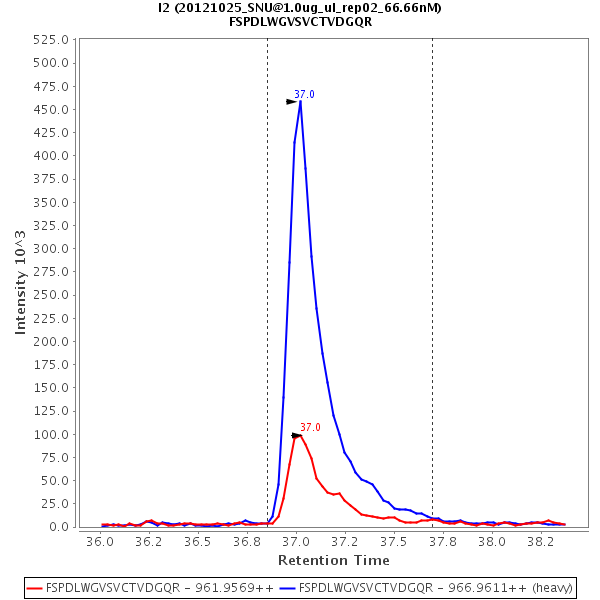
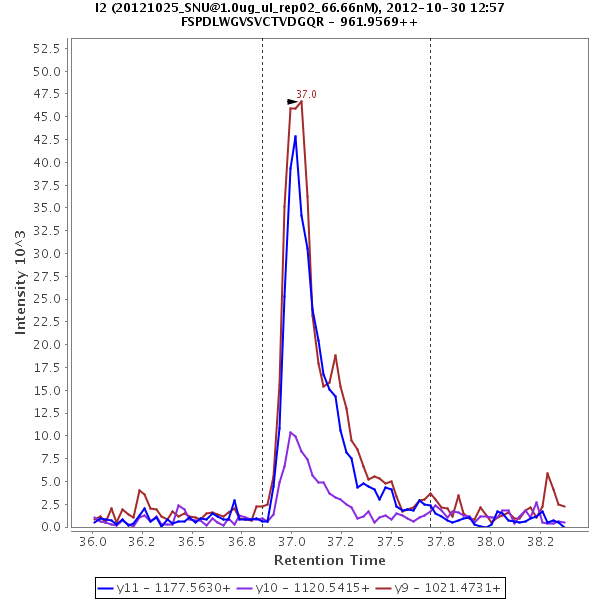
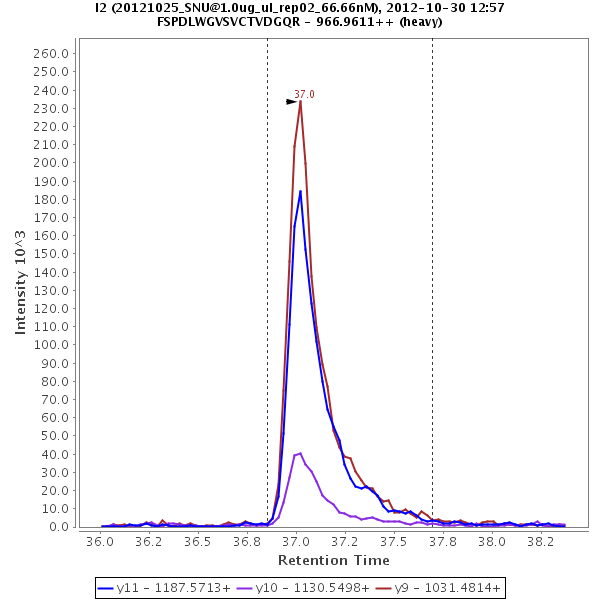
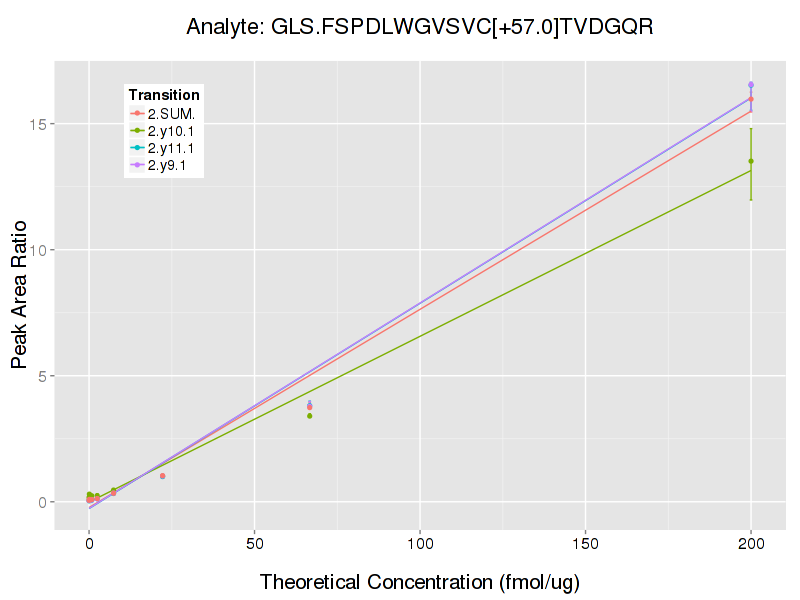
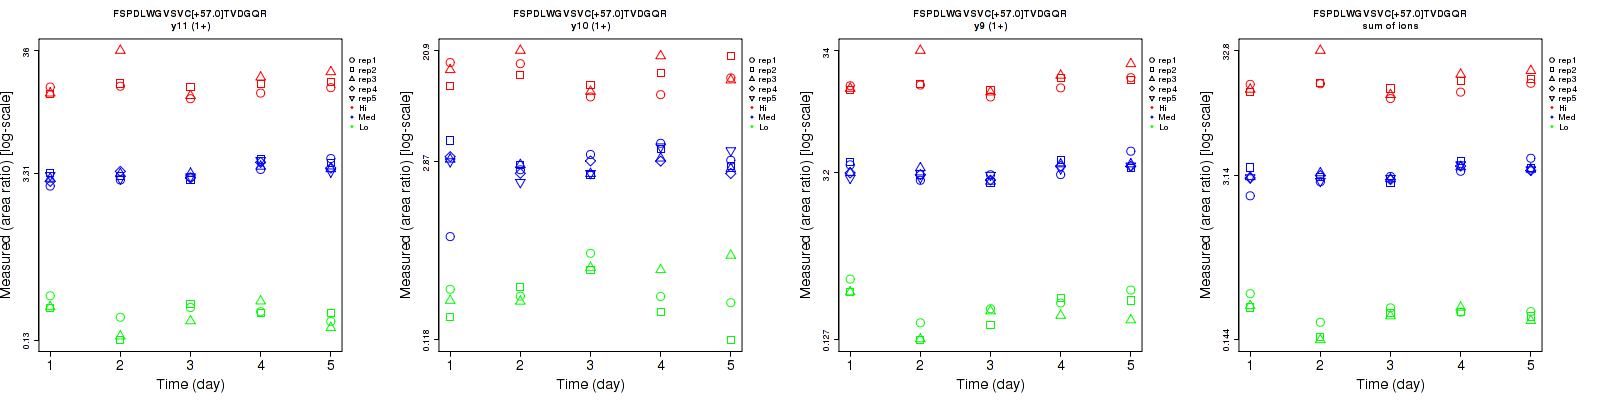
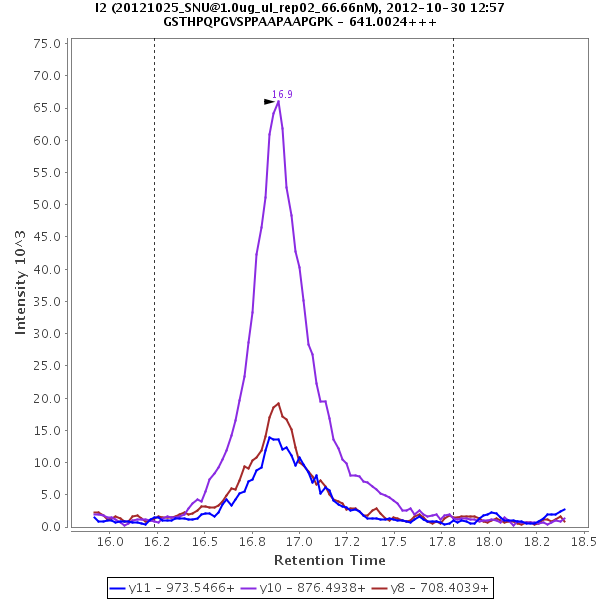
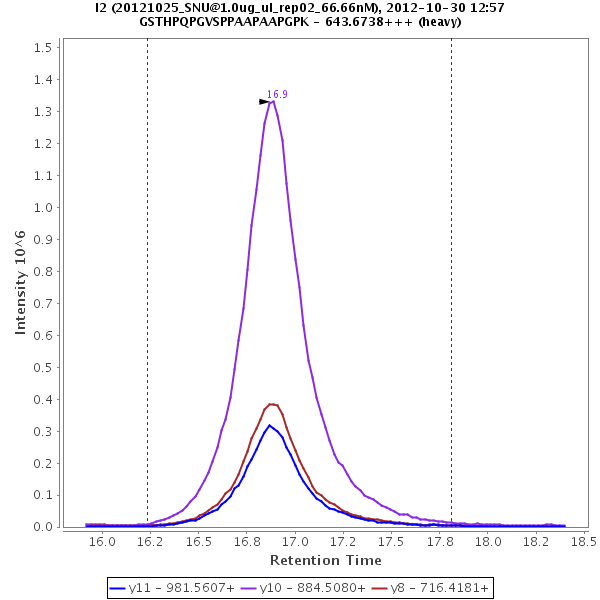
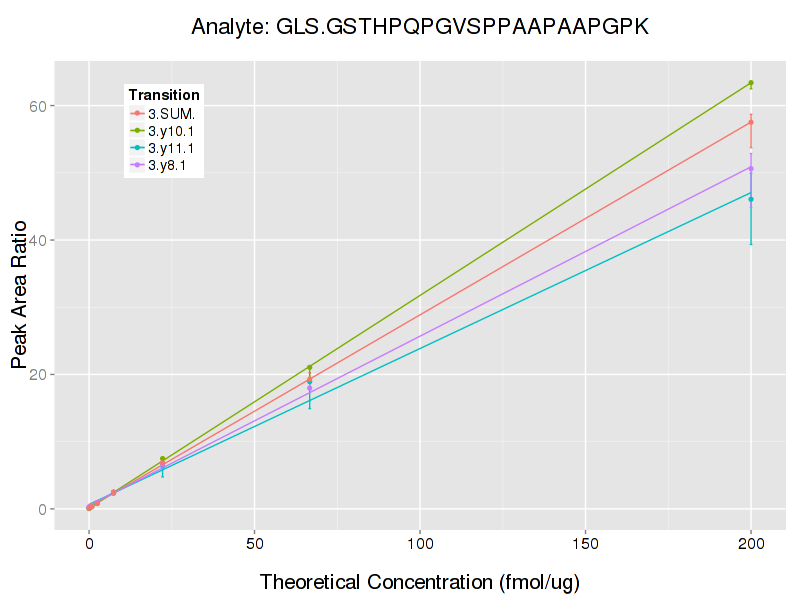
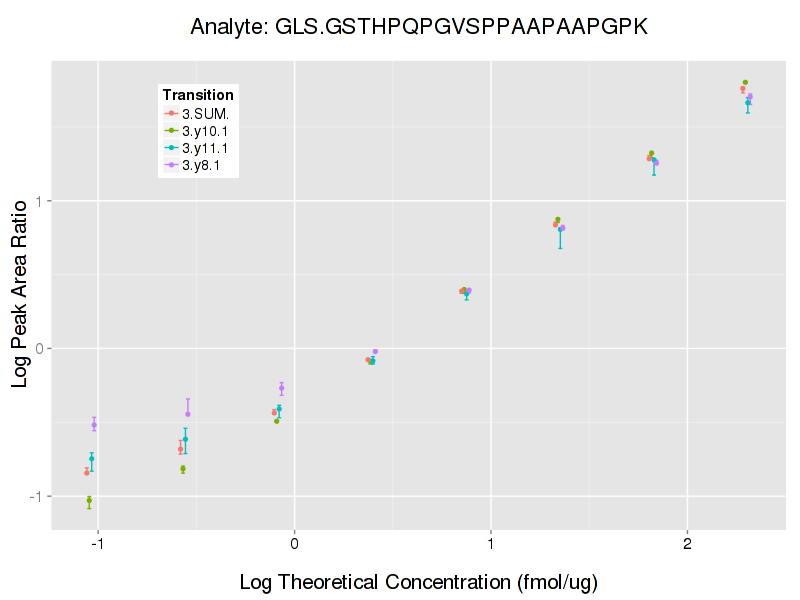
Response curves acquired at Seoul National University / Korea Institute of Science and Technology. Repeatability data acquired at Fred Hutchinson Cancer Research Center.
Response curves acquired at Seoul National University / Korea Institute of Science and Technology. Repeatability data acquired at Fred Hutchinson Cancer Research Center.
Data source: Panorama
Data source: Panorama
Data source: Panorama
Retrieving Data
Data source: Panorama
| Average intra-assay CV (within day CV) |
Average inter-assay CV (between day CV) |
Total CV |
n= | |||||||||
|---|---|---|---|---|---|---|---|---|---|---|---|---|
| Fragment ion / Transition | Low | Med | High | Low | Med | High | Low | Med | High | Low | Med | High |
| y11 (1+) | 16.5 | 8 | 18.5 | 23.8 | 15.6 | 18.9 | 29 | 17.5 | 26.4 | 15 | 25 | 15 |
| y10 (1+) | 33.5 | 20.9 | 22.4 | 42 | 24.4 | 27 | 53.7 | 32.1 | 35.1 | 15 | 25 | 15 |
| y9 (1+) | 19 | 10.7 | 16.3 | 33.5 | 15.3 | 19.5 | 38.5 | 18.7 | 25.4 | 15 | 25 | 15 |
| sum | 11 | 9.4 | 16.8 | 20.9 | 15.1 | 18.9 | 23.6 | 17.8 | 25.3 | 15 | 25 | 15 |
Data source: Panorama
View Details (opens in a new window)
Demonstrating the feasibility of large-scale development of standardized assays to quantify human proteins. Kennedy JJ, Abbatiello SE, Kim K, Yan P, Whiteaker JR, Lin C, Kim JS, Zhang Y, Wang X, Ivey RG, Zhao L, Min H, Lee Y, Yu MH, Yang EG, Lee C, Wang P, Rodriguez H, Kim Y, Carr SA, Paulovich AG. Nat Methods. 2014 Feb;11(2):149-55. doi: 10.1038/nmeth.2763. Epub 2013 Dec 8. PMID: 24317253
Response curves acquired at Seoul National University / Korea Institute of Science and Technology. Repeatability data acquired at Fred Hutchinson Cancer Research Center.
Response curves acquired at Seoul National University / Korea Institute of Science and Technology. Repeatability data acquired at Fred Hutchinson Cancer Research Center.
Data source: Panorama
Data source: Panorama
Data source: Panorama
Retrieving Data
Data source: Panorama
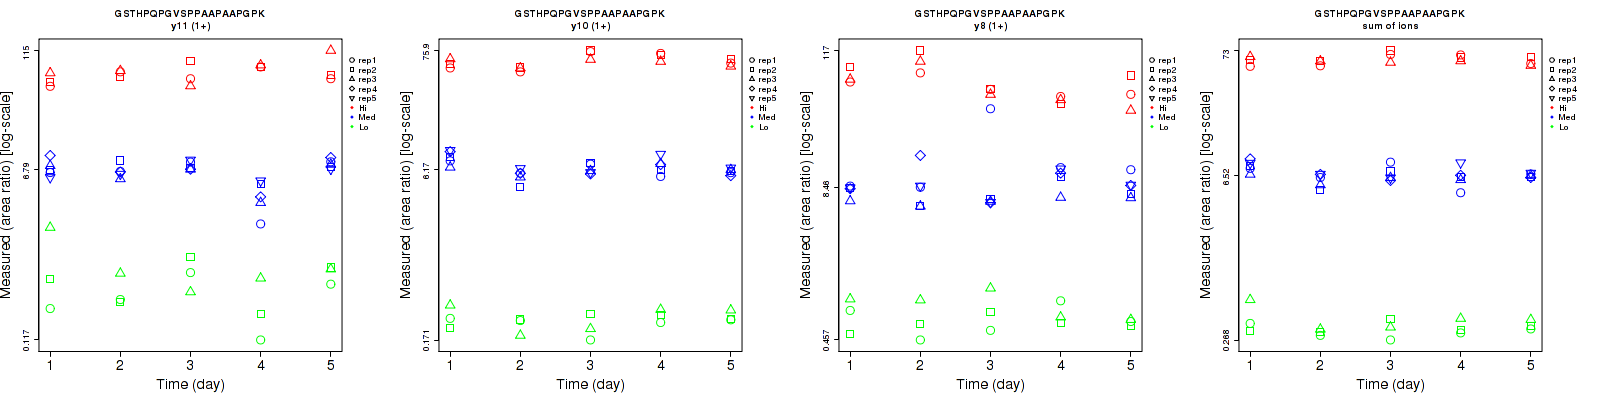
| Average intra-assay CV (within day CV) |
Average inter-assay CV (between day CV) |
Total CV |
n= | |||||||||
|---|---|---|---|---|---|---|---|---|---|---|---|---|
| Fragment ion / Transition | Low | Med | High | Low | Med | High | Low | Med | High | Low | Med | High |
| y11 (1+) | 53.7 | 19.2 | 19.7 | 58.5 | 29.2 | 23.1 | 79.4 | 34.9 | 30.4 | 15 | 25 | 15 |
| y10 (1+) | 18.9 | 12.5 | 8.1 | 18 | 18.1 | 13.8 | 26.1 | 22 | 16 | 15 | 25 | 15 |
| y8 (1+) | 28.1 | 41.7 | 16.9 | 23.4 | 33.3 | 32.2 | 36.6 | 53.4 | 36.4 | 15 | 25 | 15 |
| sum | 16.7 | 12.7 | 8.2 | 15.8 | 15.3 | 8.6 | 23 | 19.9 | 11.9 | 15 | 25 | 15 |
Comments