
| Official Gene Symbol | Other Aliases |
|---|---|
| Lifr | N/A |
| Sequence Length (AA) | Molecular Weight (Da) |
|---|---|
| 1092 | 122574 |
| Protein Name |
|---|
| Leukemia inhibitory factor receptor |
| Sources | |
|---|---|
|
UniProt PhosphoSitePlus ® GeneCards |
Human Protein Atlas |
| 10 | 20 | 30 | 40 | 50 |
| MAAYSWWRQP | SWMVDNKRSR | MTPNLPWLLS | ALTLLHLTMH | ANGLKRGVQD |
| 60 | 70 | 80 | 90 | 100 |
| LKCTTNNMRV | WDCTWPAPLG | VSPGTVKDIC | IKDRFHSCHP | LETTNVKIPA |
| 110 | 120 | 130 | 140 | 150 |
| LSPGDHEVTI | NYLNGFQSKF | TLNEKDVSLI | PETPEILDLS | ADFFTSSLLL |
| 160 | 170 | 180 | 190 | 200 |
| KWNDRGSALP | HPSNATWEIK | VLQNPRTEPV | ALVLLNTMLS | GKDTVQHWNW |
| 210 | 220 | 230 | 240 | 250 |
| TSDLPLQCAT | HSVSIRWHID | SPHFSGYKEW | SDWSPLKNIS | WIRNTETNVF |
| 260 | 270 | 280 | 290 | 300 |
| PQDKVVLAGS | NMTICCMSPT | KVLSGQIGNT | LRPLIHLYGQ | TVAIHILNIP |
| 310 | 320 | 330 | 340 | 350 |
| VSENSGTNII | FITDDDVYGT | VVFAGYPPDV | PQKLSCETHD | LKEIICSWNP |
| 360 | 370 | 380 | 390 | 400 |
| GRITGLVGPR | NTEYTLFESI | SGKSAVFHRI | EGLTNETYRL | GVQMHPGQEI |
| 410 | 420 | 430 | 440 | 450 |
| HNFTLTGRNP | LGQAQSAVVI | NVTERVAPHD | PTSLKVKDIN | STVVTFSWYL |
| 460 | 470 | 480 | 490 | 500 |
| PGNFTKINLL | CQIEICKANS | KKEVRNATIR | GAEDSTYHVA | VDKLNPYTAY |
| 510 | 520 | 530 | 540 | 550 |
| TFRVRCSSKT | FWKWSRWSDE | KRHLTTEATP | SKGPDTWREW | SSDGKNLIVY |
| 560 | 570 | 580 | 590 | 600 |
| WKPLPINEAN | GKILSYNVSC | SLNEETQSVL | EIFDPQHRAE | IQLSKNDYII |
| 610 | 620 | 630 | 640 | 650 |
| SVVARNSAGS | SPPSKIASME | IPNDDITVEQ | AVGLGNRIFL | TWRHDPNMTC |
| 660 | 670 | 680 | 690 | 700 |
| DYVIKWCNSS | RSEPCLLDWR | KVPSNSTETV | IESDQFQPGV | RYNFYLYGCT |
| 710 | 720 | 730 | 740 | 750 |
| NQGYQLLRSI | IGYVEELAPI | VAPNFTVEDT | SADSILVKWD | DIPVEELRGF |
| 760 | 770 | 780 | 790 | 800 |
| LRGYLFYFQK | GERDTPKTRS | LEPHHSDIKL | KNITDISQKT | LRIADLQGKT |
| 810 | 820 | 830 | 840 | 850 |
| SYHLVLRAYT | HGGLGPEKSM | FVVTKENSVG | LIIAILIPVA | VAVIVGVVTS |
| 860 | 870 | 880 | 890 | 900 |
| ILCYRKREWI | KETFYPDIPN | PENCKALQFQ | KSVCEGSNAL | KTLEMNPCTP |
| 910 | 920 | 930 | 940 | 950 |
| NNVEVLESRS | IVPKIEDTEI | ISPVAERPGE | RSEVDPENHV | VVSYCPPIIE |
| 960 | 970 | 980 | 990 | 1000 |
| EEITNPAADE | VGGASQVVYI | DVQSMYQPQA | KAEEEQDVDP | VVVAGYKPQM |
| 1010 | 1020 | 1030 | 1040 | 1050 |
| RLPISPAVED | TAAEDEEGKT | AGYRPQANVN | TWNLVSPDSP | RSTDSNNEVV |
| 1060 | 1070 | 1080 | 1090 | 1092 |
| SFGSPCSINS | RQFLIPPKDE | DSPKSNGGGW | SFTNFFQNKP | ND |
Data source: UniProt
Uniprot Database Entry PhosphoSitePlus ®
loading

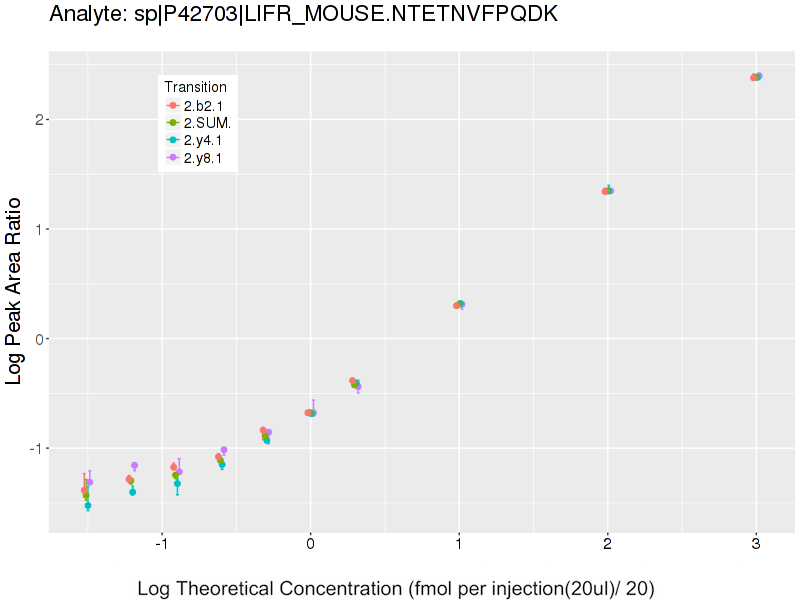
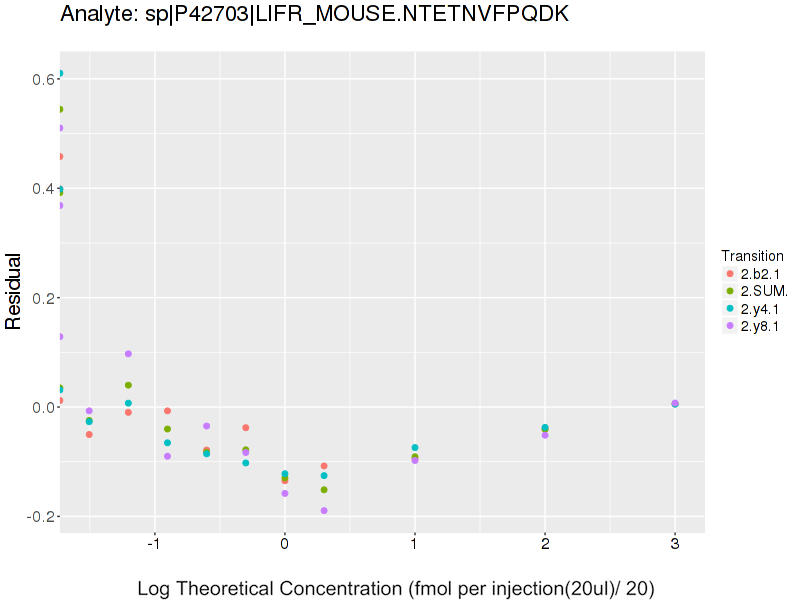
Data source: Panorama
View Details (opens in a new window)
Molecular phenotyping of laboratory mouse strains using 500 multiple reaction monitoring mass spectrometry plasma assays. Michaud SA, Sinclair NJ, Petrošová H, Palmer AL, Pistawka AJ, Zhang S, Hardie DB, Mohammed Y Eshghi A1, Richard VR, Sickmann A, Borchers CH. Commun Biol. 2018 Jun 27;1:78. doi: 10.1038/s42003-018-0087-6. eCollection 2018.
Data source: Panorama
Data source: Panorama
Data source: Panorama
Retrieving Data
Data source: Panorama
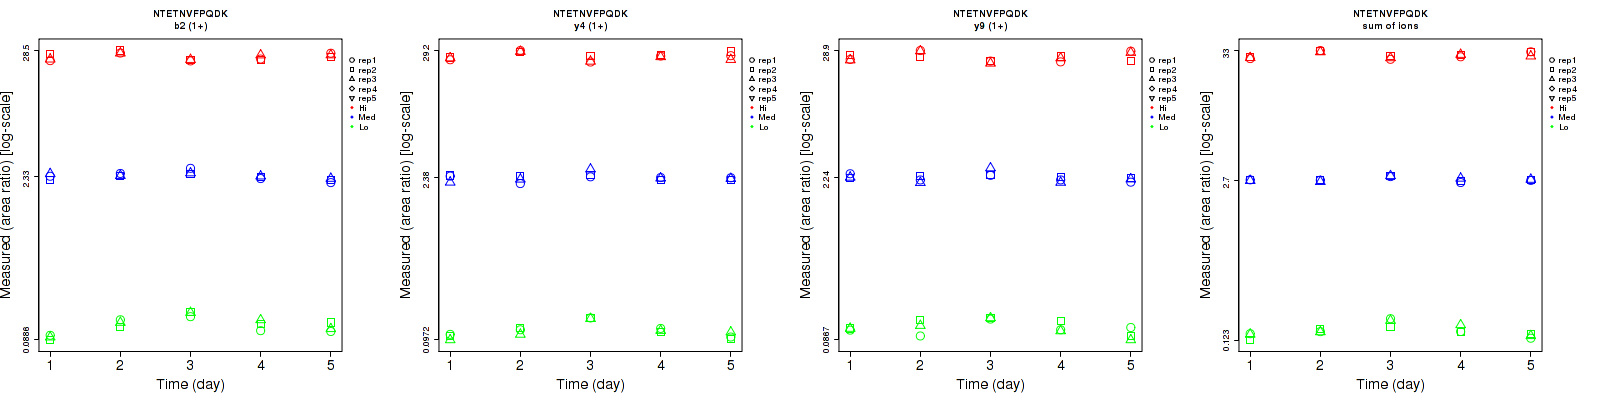
| Average intra-assay CV (within day CV) |
Average inter-assay CV (between day CV) |
Total CV |
n= | |||||||||
|---|---|---|---|---|---|---|---|---|---|---|---|---|
| Fragment ion / Transition | Low | Med | High | Low | Med | High | Low | Med | High | Low | Med | High |
| y8 (1+) | 5 | 7.9 | 5 | 14 | 8.2 | 7.7 | 14.9 | 11.4 | 9.2 | 15 | 15 | 15 |
| y9 (1+) | 8.7 | 6 | 6.2 | 14.3 | 7.5 | 9 | 16.7 | 9.6 | 10.9 | 15 | 15 | 15 |
| b2 (1+) | 7.3 | 4.3 | 4.2 | 18.1 | 6.9 | 7.3 | 19.5 | 8.1 | 8.4 | 15 | 15 | 15 |
| y4 (1+) | 4.5 | 5.4 | 4.1 | 16 | 6.9 | 7.2 | 16.6 | 8.8 | 8.3 | 15 | 15 | 15 |
| y5 (1+) | 15.8 | 7.2 | 5.7 | 16 | 8.6 | 7.8 | 22.5 | 11.2 | 9.7 | 15 | 15 | 15 |
| sum | 5.9 | 1.6 | 2.7 | 12.5 | 4.1 | 5.9 | 13.8 | 4.4 | 6.5 | 15 | 15 | 15 |
Comments